Web Traffic Analysis
Google Analytics web traffic analysis
Web Traffic Analysis helps to gain insights about visitors and their behavior on our websites to deliver better results. BigQuery and Google Analytics provide you the information needed to improve the website, and make it the best it can be.
The following subdomains are included:
- about.gitlab.com (primary for marketing analysis)
- docs.gitlab.com
- forum.gitlab.com
- customers.gitlab.com
- learn.gitlab.com
Why is BigQuery data used to analyze Google Analytics Data?
- No more sampled data
- Unlimited amount of dimensions
- Combining different scopes in one report (e.g.: session with hit)
- Build custom Channel Grouping and correct data errors
- Combine Google Analytics data with third party data sources (e.g.: trial pageviews with trial campaign members in Salesforce)
Quick Links:
- Learn Google Analytics fundamentals: Analytics Academy Online Courses
- Understand format and schema of BigQuery data: BigQuery Export Schema - Columns
- Information about Google Analytics implementation for Denomas public websites Marketing Web Analytics - Inbound Mktg
- SaaS Trial Sisense dashboard using BigQuery data: SaaS Trial Dashboard
Data Caveats and Constraints
- Number of users (Nbr of users) will always have approx 0.1-0.2% discrepancy between BigQuery and Google Analytics 360 UI. This is because Google Analytics shows an approximation for users, Big Query is exact.
- When reporting on hit level data (e.g.: pageviews), you need to link
google_analytics_360.session_hittable toanalytics.ga360_session_xfin order to filter by session_date, as there it is currently not available on hit level data (this is WIP in this (internal link) issue)
Data Security Classification
Google Analytics stores unique identifiers such as client id, visitor id that requires ORANGE classification
Solution Ownership
- Source System Owner:
@shanerice - Marketing Strategy & Performance Subject Matter Expert:
@vjuhasz - Data Team Subject Matter Expert:
@paul_armstrong@jeanpeguero
Key Terms
- Session (aka visits): a group of user interactions with the website that take place within a given time frame. For example a single session can contain multiple page views, events, social interactions. The session expires at midnight and after a certain time of inactivity, that is 60 minutes on Denomas subdomains.
- Pageviews: the number of times users view a page that has the Google Analytics tracking code inserted. This covers all page views; so if a user refreshes the page, or navigates away from the page and returns, these are all counted as additional page views.
- Unique Pageviews: The number of unique pageviews is calculated by counting a page viewed multiple times by the same user during the same session only one time.
- New Visitors: New visitors/users are those users that have not visited your site before the time period specified
- Returning Visitors: Returning visitors/users made at least one visit to at least one page on the site previously. This is determined by whether Google Analytics can detect cookies, which indicate previous visits. If Google cannot detect a cookie one will be set for future recording, unless the user has disabled cookies in their personal browser preferences.
- Bounce Rate: it is given as a percentage and represents the number of visits when users leave the site after just one page; regardless of how they got to the site or how long they stayed on that page.
- Hits: interactions during a visit, including pageviews, events, and transactions
- Events: events help you measure activity that may not otherwise be recorded by the tracking code; these may include when a user plays a video, click on CTA etc.
- Custom dimensions: they enable you to record additional, non-standard data in Google Analytics, such as blog post tag, blog post type (author of blog post), etc
Key Metrics, KPIs, and PIs
- Sessions: in order to properly query and match BigQuery web traffic data in Sisense with Google Analytics UI, you need to create a session id that overrides the midnight split:
CONCAT(visitor_id, CAST(visit_start_time AS STRING) - Users: calculating users should be based on visitor_id
COUNT(DISTINCT visitor_id). Google Analytics takes all rows into account while calculating users (unlike sessions) - New Users: calculating users should be based on visitor_id
COUNT(DISTINCT visitor_id)whereTOTAL_NEW_VISITS IS NOT NULL - Pageviews: this metric is based on hit level data and every row should be counted
COUNT(1)whereHIT_TYPE = 'PAGE' - Unique pageviews: this metric is also based on hit level data, and in order to count the unique pageviews within a session, you have to concatenate the session id (explained in the Sessions KPI) with
PAGE_PATHwhereHIT_TYPE = 'PAGE'. The results for all pages might have approx. -0.2% difference compared to Google Analytics UI. - Bounce rate:
coming soon
Key Fields and Business Logic
session_date: every report including date dimension should be based onsession_dateinstead ofvisit_start_timevisitor_id: used to create session id and to calculate userstotal_visits: the number of sessions. This value is1for sessions with interaction events. The value isnullif there are no interaction events in the session. Google Analytics shows interactive sessions only, this should be considered while querying nbr of sessionshit_type: type of the hit that can bePAGEorEVENTpage_path: URL path of the page, e.g.: /free-trial/host_name: this is used to filter by the different subdomains (about.gitlab.com, docs.gitlab.com, etc)
Snippets
Coming Soon
Reference SQL
The below SQL queries define the calculation of each main metric that is matching with Google Analytics UI results (All Data - Raw No Filters view)
Nbr of sessions, users and new users by day in Sept 2020
|
|
Nbr of total and trial pageviews by day from Feb 2020
|
|
Entity Relationship Diagrams
Coming Soon
Data Platform Solution
Data Lineage
Google Analytics 360/ BigQuery data is based on All Data - Raw No Filters view that is using (GTM-08:00) Los Angeles Time zone. Google Analytics 360/BigQuery data is available from 19th Feb 2020 in Sisense. These are essential to know this while comparing your query results with Google Analytics 360 UI.
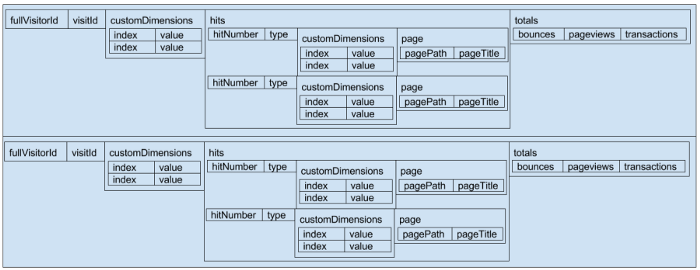
Each row in the Google Analytics BigQuery represents a single session. There are a lot of dimensions and metrics on Google Analytics UI, this schema can be a bit overwhelming on database level. The below picture represents 2 sessions that helps to get a better understanding of the BigQuery data structure:
To get more clarity about BigQuery export schema, take a look at the below interactive tree map:

There are 3 major BigQuery tables that are crucial to perform web traffic analysis:
- analytics.ga360_session_xf: session level data that is used to calculate nbr of sessions, users, unique visitors
- google_analytics_360.session_hit: hit level data to calculate pageviews, events, etc
- ga360_session_custom_dimension_xf: for reporting on Denomas specific dimensions (this depends on the scope defined for each custom dimension, more info here)
DBT Solution
Coming Soon
Trusted Data Solution
Coming Soon
EDM Enterprise Dimensional Model Validations
Coming Soon
RAW Source Data Pipeline validations
Coming Soon
176cf9ec)
