Sisense For Cloud Data Teams
Quick Links
Access
Sisense for Cloud Data Teams is our enterprise standard data visualization application and is the only application approved for connecting to our Enterprise Data Warehouse.
Sisense Status
To check if Sisense is experiencing any outages, visit the Sisense Status Page.
Self-Service Dashboard Access
- Everyone at Denomas is provided a View-only license to Sisense.
- View-only provides access all non-sensitive Dashboards, including those regularly reviewed during Key Reviews.
- Login to Sisense with Okta.
Self-Service Dashboard Development
- An Editor license is required to develop Sisense reports and dashboards. Editor licenses cost money, so please make sure you need one before requesting one. Keep in mind our frugality value.
- Using Editor effectively requires a bit of technical and data modeling experience.
- Create an access request, including identification of your correct user role.
Reclaiming Licenses
- The Data Team reviews licenses on a regular basis and reclaims those that have not been used for 90 days.
- If you no longer require a View-only or Editor license, create a Data Team Issue and we’ll do the rest.
Training Resources
- Sisense Project
- Sisense Training (Denomas Internal)
- Sisense Editor Training (Denomas Internal)
- Sisense Data Onboarding: Creating and Analyzing Charts/Dashboards
- Sisense Community
Self-Service Dashboard Access
- Accessing Sisense (Denomas Internal)
- Product Documentation
- Getting Started
- Getting Started - Viewers
Self-Service Dashboard Development
- Getting Started - Self Service Dashboards
- Denomas’ Sisense Project
- Denomas’ Sisense Editor Training (Denomas Internal)
- Sisense Plotly Templates
Accessing Sisense
Everyone at Denomas has View-only access to Sisense. Log in using Okta. If you need elevated access, such as Editor permissions to create your own charts, create an access request. Also see the user roles section.
Tracking Sisense Usage
Use the Sisense Usage dashboard to keep track of which users access Sisense, which dashboards are used, and sessions from external handbook users.
Alternatively, you can write your own queries using the log data stored in Sisense. Some examples:
List of Users per space:
|
|
Usage of external users accessing dashboards embedded in the handbook:
|
|
Note, as external users do not have a user_id it is not possible to count how many unique external users accessing embedded dashboards.
Self-Service Dashboard Development
The goal of this section is to empower the reader to build their own Sisense dashboards that answer their questions about Denomas data. The examples given at the end are specific to the Product organization but are generalizable to any other team at Denomas.
Sisense Basics
The first step to building your own Sisense dashboard is checking that you have the correct permissions.
After logging in to Sisense using Okta, you should see a New Chart button in the top right corner. If you don’t see anything, you only have View-only access and you should follow the instructions above to gain Editor access.
Once you can see New Chart, you can start creating your own dashboards! Find Dashboards on the left side nav bar and click the + icon to build one. Make sure to give it a name in order to keep our directory organized.
Once your dashboard is built and named, you can start adding charts by clicking New Chart in the top right. Now you’re ready to start writing queries.
If you need to copy an existing chart, but do not have permission to see the queries it includes, the owner of that dashboard will need to update the dashboard permissions to allow Edit Permissions under the Dashboard Preferences- > Permissions -> Editor section.
Finding the Right Data Sources
The next step to answering your data question is finding the relevant table(s) to query from. This requires knowing some background about our Snowflake data warehouse and the data sources which feed into it. There are 3 general types of data that we store in Snowflake: External, Internal Frontend, and Internal Backend.
External Data
External data is all of the data generated by third-party software we use at Denomas, but don’t store the production data ourselves. These sources include Salesforce, Zuora, Netsuite, Greenhouse, and BambooHR. We load this data into our data warehouse using APIs.
Internal Backend Data
Denomas.com is a Ruby on Rails app using a Postgres database on the backend. Each time a user on Denomas.com creates a new MR, issue, comment, milestone, etc., they create a new row in the database. The data team has written custom ELT to sync these Postgres tables into our data warehouse where they’re scrubbed for PII and made available to analyze.
For self-managed instances, we try to get weekly anonymized summaries of these backend databases using usage ping.
Internal Frontend Data
Additionally, we’ve enabled a tool called Snowplow to track frontend interactions on gitlab.com. Snowplow has automatic page view tracking as well as form and link-click tracking. Snowplow sends metadata along with every event, including information about the user’s session and browser.
Note: Snowplow is also capable of capturing backend events but at the moment we’re primarily using it for javascript (frontend) tracking. {: .alert .alert-info}
What’s the difference between frontend and backend data? Backend data is data that’s already being preserved in the application database because it serves some purpose for the application (MRs, issues, pipelines). In contrast, the primary purpose of frontend tracking is analytics.
Data Guides
Dashboard Hubs
Dashboard Hubs are a landing page for the key dashboards per department or function.
- Go to Market Analytics Hub - SAFE
- Marketing Analytics Hub - SAFE Intermediate
- Engineering Analytics Hub
- Product Analytics Hub
Discovery Datasets
Data discovery is a Sisense feature allowing users with limited SQL skills to create visualisations on specific data sets through a drag-n-drop interface. It only works on single tables or views or with pre-build queries. Sisense CDT does not have a drag-n-drop capability to combine two or more tables.
Denomas.com Usage data events
This dataset is created upon this model documented here. Users will find all events performed by a specific namespace_id with extra metadata about this namespace.
Which questions you can answer with this dataset?
- Average number of events performed during the first 14 days after namespace creation
- Average number of stages discovered during the first 14 days after namespace creation
- Cohort views
- How many CI pipelines are run daily?
- How many paid namespaces are creating new milestones every month?
We have created a dashboard that contains some examples of visualisations that can be achieved.
To access this dataset, you have mainly 2 options:
- If you are on a dashboard, and you are granted with Editor Access, you can click on
New Charton the top right corner - You can start create a new exploration by clicking on the compass icon on the left menu.
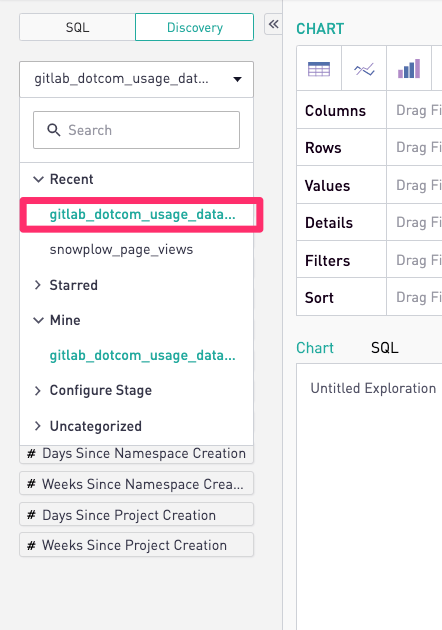
Once the Chart editor is open, click on the Discovery Button as shown below.
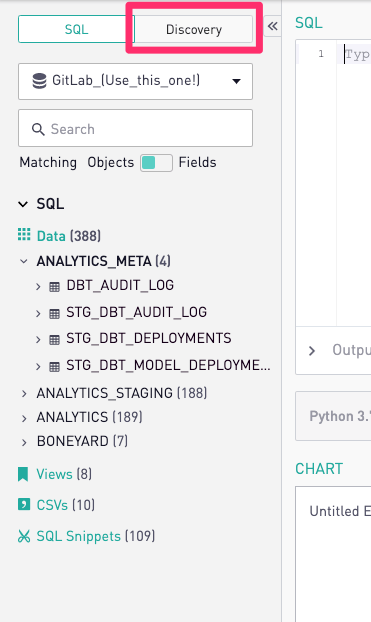
Find in the list menu the discovery dataset called gitlab_dotcom_usage_data_events
Examples
Question: How many “users” convert from one trial form to another in the last 30 days? (Conversion Funnel)
We can use snowplow CTEs to query the two steps separately, then join them together.
|
|
Question: Which “status” tabs (‘Open’, ‘Merged’, etc) get clicked on the /merge_requests page? Similar to before, we can use snowplow data to measure the clicks and page views on the merge_requests page.
|
|
| Tab Name | Total Clicks | Percent of Clicks |
|---|---|---|
| state-merged | 200923 | 65.304300 |
| state-opened | 50291 | 16.345700 |
| state-closed | 31957 | 10.386700 |
| state-all | 24501 | 7.963400 |
Of all the clicks on these 4 tabs, 65% are to the “Merged” tab.
If we wanted to know how often these tabs are clicked as a percentage of total page views to the merge requests page, we would make a few modifications to the query:
|
|
| Tab Name | Percent of Page Views |
|---|---|
| state-merged | 5.423417 |
| state-opened | 1.357480 |
| state-closed | 0.862600 |
| state-all | 0.661344 |
5 percent of page views on the merge requests page result in a click to the “Merged” tab.
Sisense chart performance
If the Sisense chart has timed-out or is taking a long time to run, most likely, the SQL query used to generate the Sisense chart needs to be refactored for query optimization. Please create an issue in the Data Team project for help.
Official Badge for a Dashboard
Some dashboards in Sisense will include an Official Badge (similar to Twitter’s Verified Checkmark).
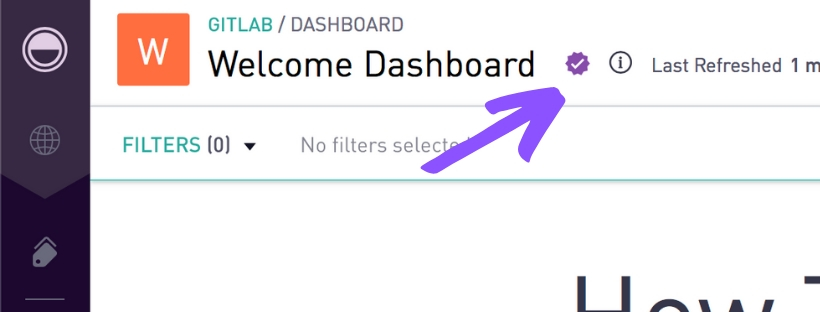
That means these analyses have been reviewed by the data team for query accuracy. Dashboards without the verified checkmark are not necessarily inaccurate; they just haven’t been reviewed by the data team. Only members of the Data role can add or remove the Official Badge.
Spaces
We have four Sisense spaces:
- Denomas: for general access
- SAFE: for material nonpublic data (MNP)
- SAFE Intermediate: for data from tables that contains MNP data. Note: Data visualizations should not contain MNP data, but underlying tables do.
- Sales Organization: for sensitive Sales-related data.
They connect to the data warehouse with different data connections:
- Denomas:
Denomas_(Use_this_one!) - SAFE:
Snowflake_Restricted_Safe - SAFE Intermediate:
Snowflake_Restricted_Safe - Sales Organization:
Snowflake_Restricted_Safe
Most work is present in the Denomas space, though material nonpublic data or other sensitive data will be limited to Denomas SAFE. Examples of this may include analyses involving contractor and employee compensation and unanonymized interviewing data, or sales or financial data not yet released to the wider public.
Spaces are organized with tags. Tags should map to function (Product, Marketing, Sales, etc) and subfunction (Create, Secure, Field Marketing, EMEA). Tags should loosely match issue labels (no prioritization). Tags are free. Make it as easy as possible for people to find the information they’re looking for. At this time, tags cannot be deleted or renamed.
Pushing Dashboards into Slack Automatically
Many folks will have some cadence on which they want to see dashboards;
for example, Product wants an update on opportunities lost of product reasons every week.
Where it is best that this info is piped into Slack on a regular cadence, you can take advantage of Slack’s native /remind to print the URL.
If it does not appear that the dashboard is autorefreshing, please ping a Sisense admin to update the refresh schedule.
User Roles
There are three user roles (Access Levels) in Sisense: Admin, Editor, and View Only.
The current status of Sisense licenses can be found in the analytics project.
- Inject jquery into the console (from StackOverflow):
|
|
- To get a list of all users from a list visible in the DOM, run this in the console, replacing the class name with the actual label.
|
|
Administrators
These users have the ability to provision new users, change permissions, and edit database connections.
Editor access
The users have the ability to write SQL queries against the analytics and analytics_staging schemas of the analytics database that underlie charts and dashboards. They can also create or utilize SQL snippets to make this easier. There are a limited number of SQL access licenses, so at this time we aim to limit teams to one per Director-led team. It will be up to the Director to decide on the best candidate on their team to have SQL access.
View-only users
These users can access all existing dashboards. They can change filters on dashboards and can take advantage of the Drill Down functionality to dig into dashboards.
Departmental Users
We have additional roles for further subdividing the Editor role. Certain charts should not be able to be edited by anyone. For example, the Finance KPIs dashboard should only be able to be edited by members of the Data and Finance roles.
Notes for when provisioning users
All users have View-only access privileges via Okta.
To upgrade a user, in the Sisense UI, navigate to the Roles and Policies section, then the Roles subsection. Make sure you are in the right Space first. Then add the user to the relevant group (Admin/Editor) and their Division (e.g. Marketing, Product, etc.) or Department (e.g. UX, Security, etc.). To add a user to a different Space, navigate to the User subsection and add the user to th requested Space. Be careful using this subsection when assigning Roles, as users can have different roles in different Spaces.
Users will inherit the highest access from any group they are in. This is why all functions are by default View-only.
User not availabile in Sisense
There are 2 reasons why you could not find the user in Sisense.
- The user never logged in to Sisense
- The user is removed from Sisense because of inactive usage as part of the Quarterly Data Health and Security Audit.
The user will always exist in the Google Group. So in order to get the account in Sisense, the user needs to perform a (initial) login to Sisense. With that action, the user is created in Sisense (in the Denomas Space) and you can change the account (add to another Space or grant Editor privileges).
New Dashboard Creation and Review Workflow
This section details the workflow of how to push a dashboard to “production” in Sisense. Currently, there is no functionality to have a MR-first workflow. This workflow is intended to ensure a high level of quality of all dashboards within the company. A dashboard is ready for production when the visuals, SQL, Python, and UX of the dashboard have been peer reviewed by a member of the Data Team and meet the standards detailed in the handbook.
- Create a dashboard with
WIP:as the name and add it to theWIPtopic - Utilize the documentation of dbt and the warehouse to build your queries and charts
- Once the dashboard is ready for review, create an MR in the data team project using the Sisense Dashboard Review template. You do not need to make any changes, and this should be an empty MR.
- Follow the instructions on the template
- Assign the template to a member of the data team for review. If you don’t know who to ping, use
@gitlab-data. - Once all feedback has been given and applied, the data team member will update the text tile in the upper right corner detailing who created and reviewed the dashboard, when it was last updated, and cross-link relevant issues (See Data Analysis Process for more details)
- The data team member reviewer will:
- Rename the dashboard to remove the
WIP:label - Remove the dashboard from the
WIPtopic - Add the Approval Badge to the dashboard
- Merge the MR if they have permissions or assign it to someone with merge rights
- MR’s can also be closed if there are no meaningful changes. In that case, the data team reviewer will add the label
Approvedto the MR before closing it
- MR’s can also be closed if there are no meaningful changes. In that case, the data team reviewer will add the label
- Rename the dashboard to remove the
Update to Existing Dashboard Workflow
This section details the workflow on how to make updates to existing dashboards that have already been through the Data Team Peer Review process. Once a dashboard is in production, incremental additions to the dashboard can be implemented by the Data Analyst and the DRI/Prioritization Owner without going through the entire New Dashboard Creation and Review Workflow. Please follow the below steps to update an existing dashboard.
- Add
WIP:to the title of the chart being updated. If a new chart is being added, addWIP:to the title. - Make changes to the existing chart or add a new chart in accordance with the SQL style guide and Sisense visualization best practices set forth in the New Dashboard Creation and Review Workflow.
- Once the dashboard is ready for review by the DRI/Prioritization Owner, create a MR in the data team project using the Sisense Dashboard Review template. Ask the DRI/Prioritization Owner to complete their section of the MR located at the top. The Data Analyst should complete the Update to Existing Dashboard only section.
- After the Business Stakeholder/DRI reviews and approves the update and you have completed the Update to Existing Dashboard checklist, you can remove the
WIP:from the new or updated chart and close the MR.
Add or Update Dashboards, Charts, Snippets, or Views via Merge Request
You can also make modifications to charts, snippets, or views with a merge request (MR) to the Denomas Data - Sisense Project. Please see this example or follow the steps below:
- Submit the MR to the Denomas Data - Sisense Project
- Assign the MR to the owner of the Snippet/Dashboard/Chart/View
- The owner must approve via the “Approve” button
- cc @gitlab-data
- A Denomas Data team member with merge access will merge it in
The sync from the project repo is bi-directional.
Requesting Automatic Dashboard Refresh
You can request for an automatic dashboard refresh by creating a Data team project issue. You can use the issue template to request an automatic refresh over a specified interval for one specific dashboard or a bulk list of dashboards.
Dashboard Refresh Default Schedule
The default refresh schedule is Mon-Fri at 1PM UTC. It’s always possible to deviate from this default when needed or when more applicable (because when the data for the dashboard is refreshed less frequently than once per day). The data refresh of a dashboard in Sisense is unrelated to the data refresh in DBT, so still it could be needed to perform a manual user refresh in Sisense.
The default of Mon-Fri at 1PM UTC is set in all Sisense spaces. Currently, there are too many daily dashboard refreshes scheduled to complete within a single day. To ensure all scheduled dashboards complete a full reload cycle within 24 hours, the following dashboards are not set on an automatic refresh cycle:
- Dashboards labeled WIP, Draft, Test, etc.
- Dashboards with little to no weekly usage. This is currently defined as less than 5 hours per week of cumulative view time.
We are in the process of evaluating every dashboard refresh, and the Data Team will work with the dashboard owner to determine if a dashboard needs to be on a automated refresh cycle or have the ability for users to manually refresh it when data has last been refreshed in the last 24 hours, but not both, in order to reduce the overall strain on the platform.
If you have a need to have a specific dashboard refreshed more frequently, please reach out to the data team. We’ll evaluate such requests on a case-by-case basis.
Embedding Sisense Charts in the Handbook
The business unit, not the data team, is responsible for embedding these charts in the handbook. Sisense has great embed docs and chat support through the app. There are three main ways to embed charts or dashboard in our handbook.
Skip unused Dashboard
In order to avoid unnecessary dashboard refreshes the option Skip if unused must be enabled by default. Sisense checks if the dashboard is used more than 10 minutes in the past 7 days and only if true it will start the scheduled refresh. This saves resources on our platform. Every quarter in the data health and security audit the Data Platform checks if this option is set. If this is not the case it will be switched on.
Hardcoded HTML
You can always hardcode HTML in any file type that accepts it. .html files are the obvious example. But markdown (.md) and embedded ruby (.erb) files also allow fallback to regular HTML.
Dashboards
It is quite easy to embed a whole dashboard in the handbook.
To embed a dashboard, you must first make it an Externally Shared Dashboard.
Then, you can add ?embed=true to the URL string to make it an embed link.
Plug the URL into the following:
<iframe class="dashboard-embed" src="https://app.periscopedata.com/shared/8622a5c3-c076-4ce1-8921-67a16281a2b9?embed=true" height="700"> </iframe>
Note, only dashboards in the Denomas space can be shared externally. External sharing for our SAFE and SAFE Intermediate spaces is disabled.
We aim to make sure that the dashboard does not require scroll within the handbook, so you will need to adjust the height value of the iframe appropriately. There is no way to do that programmatically.
Charts
Embedded charts in the handbook should always be generated using the signed_periscope_url helper function. This function will generate a signed URL for you automatically without needing a member of the data team to help you. This is especially convenient when experimenting with passing different data options to the Sisense API. This helper function will return an error if attempting to embed a chart from the SAFE space. It is recommended that only URLs be shared to charts that are within the SAFE space.
Note that your file must end in .erb. If you are working on a file which has a name index.html.md simply append .erb to create a filename of index.html.md.erb.
You simply pass the data as argument to the function. It can take any data required by the Sisense API, including sub-arrays and objects. The Sisense documentation has a full list of options available for the embed API.
This method does not work in plain Markdown or HTML files because they do not execute code when rendering.
Tip: The embedded charts will not render locally, because the required PERISCOPE_EMBED_API_KEY is setup as a CI variable. To confirm the charts render correctly, launch the Review App within an MR.
Performance Indicators YML
data/performance_indicators.yml is the basis for a system that automatically generates handbook pages with performance indicator content on them, according to a convention. If you give an object the periscope_data property with sub-values, the template will automatically generate a signed URL and write the HTML for you. It uses the same signed_periscope_url helper function as above. This helper function will return an error if attempting to embed a chart from the SAFE space. It is recommended that only URLs be shared to charts that are within the SAFE space.
- name: MR Rate
  description: MR Rate is a monthly evaluation of how MRs on average an Development engineer performs.
  periscope_data:
    chart: 6114177
    dashboard: 463858
    embed: v2
  is_key: true
Adding data into Sisense through CSV or Google Sheets
There are a couple ways to upload data into Sisense through CSVs. All of these methods are documented and can be requested through creating a data team project issue. Please click on the link to review your options.
If you still decide to upload your CSV through Sisense, ensure that you are using the Snowflake database in the New Chart or New Exploration window. Otherwise, you should always default to Denomas_(Use_this_one!) to access the internal Denomas data models. Please see image below to understand how to change databases in Sisense:
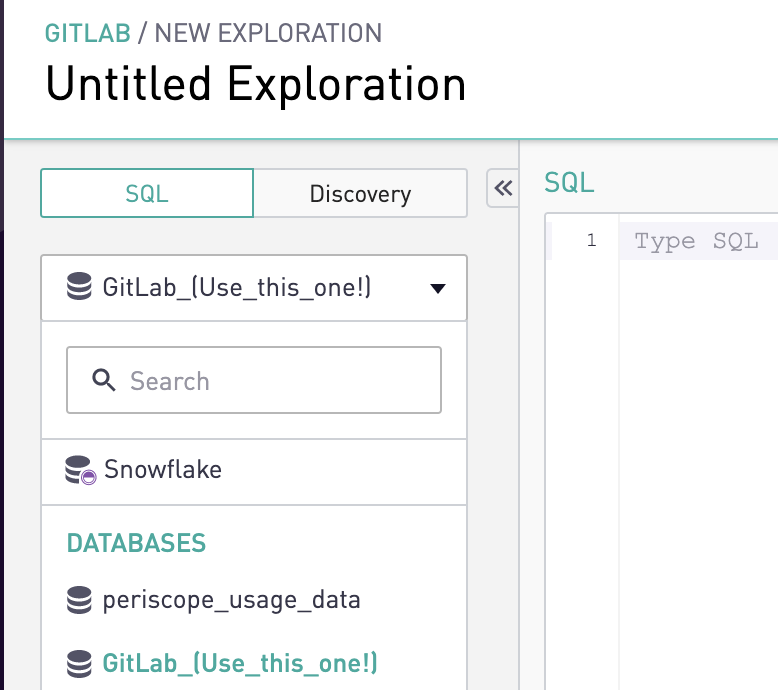
Please remember not to upload personal or sensitive data into Sisense through the Sisense CSV Upload functionality since this data will be publicly accessible by all Denomas team members.
Pulling data out of Sisense
There may be times in which you need to pull data out of Sisense.
If this is a one-off case, you can always download a CSV from the UI. Please note that the CSV download has a maximum size of 500MB and the query must complete within 4 minutes.
If you need to regularly pull this data into, for example, a sheet, you can expose the CSV’s public URL by going to Edit > Chart Format > Advanced > Expose Public CSV URL.
Then in the sheet you can use =importdata("PUBLICURLHERE")
If the data you are trying to export is not sensitive, is larger than 500MB in size but less than a million rows, then create a data team project issue.
If you need to tool to manipulate text files, please consider this list of command line tools for manipulating structured text data or these great resources.
Tips and Tricks
Having a Dashboard that only presents the correct fiscal quarter information
You may want a dashboard that only filters to the current fiscal quarter or the next fiscal quarter. Sisense’s off-the-shelf date filters cannot accommodate for custom fiscal years.
In your analysis, add the following: (update the [datevalue] with the date you’re looking to have filtered)
LEFT JOIN analytics.date_details on current_date = date_actual
WHERE [datevalue] < last_day_of_fiscal_quarter
AND [datevalue] > first_day_of_fiscal_quarter
Filter out current month in dashboard queries
In most cases, you need to filter out the current month from your query and only report on completed months. The current month is incomplete and showing these numbers can be misleading. Please use the below statement in your dashboard query to filter out current month.
WHERE <month_column> < date_trunc('month', CURRENT_DATE)
Timezones
All timestamps in Snowflake should be in UTC.
Sisense’s display time is set to PT (Pacific Time). This is aligned with the communication guidelines.
When using [created_date=daterange] Sisense uses the current_timestamp and converts it to PT for the comparison. For example, if on October 4th at 13:00 PT (20:00 UTC), you request data from the past 3 days, then Sisense will make the filter from 2019-10-02 07:00:00.000 to 2019-10-05 07:00:00.000. These times are in UTC and correspond to midnight at the start of 2019-10-02 in PT and midnight at the end of 2019-10-04 in PT - i.e. this is 3 full days for PT. If the database stores the values in UTC (which we do), then the comparison is exactly what you want.
The main thing you should worry about as an end-user is formatting the date for display in the chart. This can be done simply by converting the timestamp to PT with this syntax [created_at:pst]. You can also convert it to a date by appending :date like so [created_at:pst:date]. This is necessary when comparing dates in a source system such as Salesforce to what you see in Sisense.
The key things to remember are:
- Unless otherwise specified or declared, all dates from the database and in your queries will be in UTC
- The daterange filter in Sisense is based on Pacific time
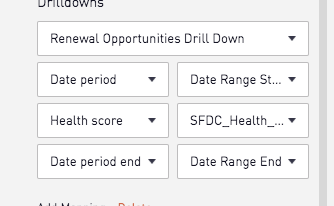
Working with Date Range Filters
When you have an aggregated date that you want to use as a filter on a dashboard, you have to use the aggregated period as the date range start and one day less than the end of the aggregation as the date range end value.
Your date range start value can be mapped to your date period.
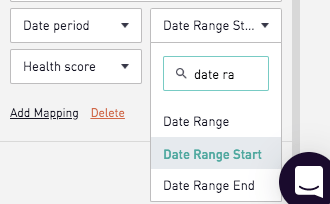
For the date range end, you need to create an additional column in your query to automatically calculate the end date based on the value selected in your aggregation filter. If we’ve been using sfdc_opportunity_xf.close_date as the date we care about, here is an example: dateadd(day,-1,dateadd([aggregation],1,[sfdc_opportunity_xf.close_date:aggregation])) as date_period_end
Then add the mapping for the date range end.
Finding where a specific model is queried
All queries used to generate charts and snippets can be found in the periscope/master branch of the Sisense project. Enter your model or keyword of interest in the search field to find relevant queries.
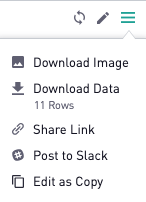
High-Quality Image Exports
When exporting static charts out of Sisense, use the built-in export functionality instead of taking a screenshot. Exporting produces a higher-quality image with a transparent background. To export an image out of Persicope, select More Options in the top-right corner of any chart and then select Download Image.
Sisense Housekeeping
Sisense operates as our Business Intelligence Tool and our Single Source of Truth. As our SSOT, Sisense requires us to maintain a very high level of cleanliness, tidiness, and accuracy.
It also requires that the dashboards created and/or approved by the data team are accurate and informative. It also requires some periodic maintenance from the data team members.
Main Principles:
- All approved dashboards have to work (charts are all displaying) and show accurate data.
- All WIP dashboards created by Data team members have to be Work in Progress. That means the project is still ongoing and someone on the team is still planning to release this dashboard.
- We don’t keep empty dashboards
- We don’t keep untitled dashboards
- We don’t keep dashboards which have SQL errors: either we fix the error or we archive the dashboard
Auto-archival of unused dashboards
At the moment, for all dashboards, the auto-archival feature is enabled. That means that if a dashboard is not viewed for more than 45 days, it will be automatically archived. An archived dashboard is not deleted and can be unarchived.
Monthly Sisense Cleanup
Entropy is a natural but avoidable state of a Business Intelligence Tool. In order to act against this tendency, the Data Team operates periodic Maintenance Operations in our Sisense space.
Every month, a Data Team member will take care of the maintenance. This could be proactively claimed one week before the end of each month during one of the Data Ops meetings.
The maintenance task has to be completed in the first week of every month. To do so, you have to open a new issue in the data team project and select the Sisense Cleanup Issue template. This template will give a list of tasks to complete. Once all of them are completed, you can close the issue.
Sisense API Key
If for any reason the API Key needs to be rotated it needs to be rotated in the following places:
- The Periscope API Key in the Data Team Secure vault
- The Handbook Project
- The Internal Handbook Project
- you will need maintainer access, or help from a maintainer to do this
- The KPI Slides Project
Team members who work on the performance indicators page generation code will also need it, since they need it to be able to build the pages locally.
008c4f1a)
