Data For Finance
The purpose of this handbook page is to help Denomas Finance Team members understand what data is available and how to self-serve in generating analysis and data insights.
How to Access Data at Denomas
Data can be accessed through Sisense (formerly known as Periscope), which is Denomas’ Business Intelligence (BI) tool and is connected to Denomas’ Snowflake data warehouse. The Sisense page of the Data team handbook has general information about Sisense aimed for a wider Denomas audience.
Finance toolkit
Some useful links that we recommend for you to bookmark:
- Information on Enterprise Dimensional Model
- DBT documentation where most of the tables are documented
- Sisense link
Sisense Quick Start Guide
- Everybody at Denomas should automatically have view access granted through Okta.
- To write your own queries and create your own charts + dashboard, you’ll need to create an access request asking for the Editor role.
The 2 basic building blocks in Sisense are charts and dashboards.
- Charts are queries to the data warehouse, materialized into visualizations.
- Dashboards are collections of charts and have a unique URL (like a “page”).
Note: If you have Editor access, you’ll be able to create both of these. New dashboards can be created on the left-hand nav bar and charts can be created by clicking “New Chart” in the top right on any dashboard where you have sufficient permissions.
Creating Charts
- Clicking “New Chart” will take you to the Sisense SQL editor. This is a safe environment, meaning you don’t need to worry about breaking any of the data infrastructure. The Sisense “user” has read access only and will kill all queries lasting longer than 5 minutes, which fits into Denomas’ frugality value.
- The variant of SQL used in the data warehouse is Snowflake SQL.
- A great way to learn about building charts is to watch this 10-minute Data Onboarding video from Sisense.
- If you do happen to experience timeouts in Sisense (you’ll see an error message saying “query killed”), reach out to the Data team for help optimizing your query or run it as a one-off with more computational resources.
- Sisense dashboards can be designated as “Official”, meaning it has been reviewed by a Data team member. If you’re interested in making your dashboard official, the process is documented here.
How do I know what tables are available?
- The Data team uses a tool called dbt for our data transformation layer. A nice feature of dbt is dbt docs, which automatically creates documentation for all of the models in our schema. Our dbt docs instance can be found here.
- Navigating to
Projects > gitlab_snowflake > modelswill give a list of all of the models (think of these as tables) that exist in the data warehouse. Models are organized in directories according to their data source.
- Navigating to
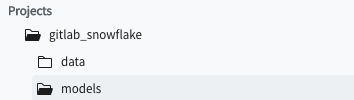
- Clicking on a model will reveal more details including documentation, a column list, and the underlying SQL.
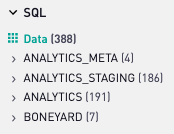
- Also, Sisense will show a list of all tables available for querying on the left-hand side while in the SQL chart editor.
- Table names are always prefixed by their source name. Models that use the Netsuite, Zuora, and Salesforce data sources will have those prefixes at the beginning of the model.
What are the top dashboards for Enterprise Resource Planning?
- 12 Month Expense Trend
- Budget vs. Actuals - Sisense Linking to Google Sheets
- Vendor Reporting
- Accounting Clean-up Dashboard
What are the top dashboards for Sales, Annual Recurring Revenue, and Retention Analyses?
- FP&A Pliny the Elder
- Finance KPIs
- Sales KPIs
- Retention
- Churned ARR
- Sisense has a concept of “Topics” which organizes dashboards into topical areas. Check out the Finance Topic to see additional dashboards available in Sisense and to get inspiration for future charts.
Historical Reporting Using Snapshot Data
Coming soon…
Snippets
Snippets are great ways to allow Periscope users to build charts without writing any SQL. Anyone with editor access can write their own snippets. Here are some snippets to get you started with your analysis:
Coming soon…
17188382)
